First-Party Data for AI Search: A Small-Business Research Workflow
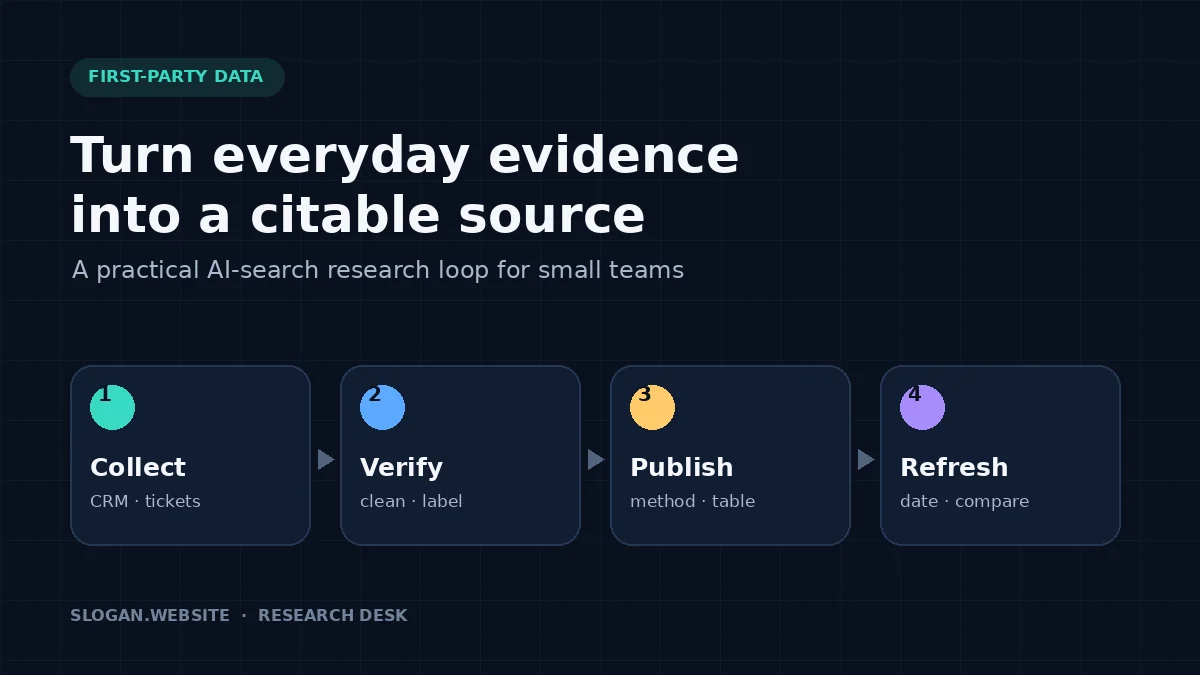
A small business produces evidence every day: sales outcomes, support questions, delivery times, product usage, survey responses, and customer language. Most of it stays inside a CRM, inbox, or spreadsheet. Turned into a careful public analysis, that evidence can become something far more useful than another opinion article: a source that customers, journalists, search engines, and AI answer systems can inspect.
The goal is not to publish private records or manufacture a dramatic statistic. It is to answer one narrow question with an explainable sample, a visible method, honest limitations, and a stable page that can improve over time.
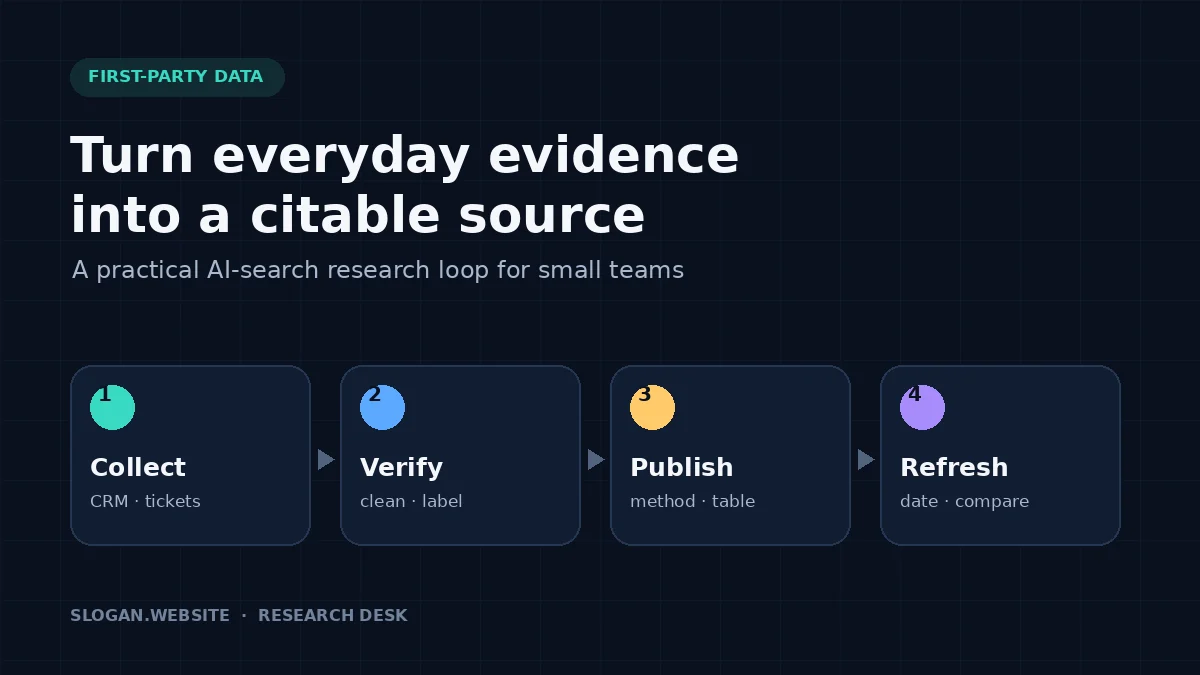
Why first-party evidence is different from generic content
Generic advice is easy to reproduce. A sentence such as “respond quickly to leads” may be sensible, but thousands of pages can say it. A dated analysis of 420 anonymized inquiries showing how response time differed between won and lost opportunities is a distinct source—provided the records, calculation, and limits are real and clear.
That distinction matters in classic search and in AI answers. A page with a specific result, visible methodology, semantic HTML table, and stable URL gives another system a concrete fact to evaluate and attribute. It also gives a human reader enough context to decide whether the finding applies to their situation.
Original evidence is not a shortcut around quality. Google's people-first content guidance asks whether content demonstrates first-hand expertise and leaves readers feeling they learned enough to reach their goal. A transparent operational study can meet that standard; a vague percentage with no sample or method cannot.
Find a useful question inside work you already do
Start with a business decision, not with a chart. The best question is narrow enough to answer from records you already collect and useful enough that a customer or operator would care about the result.
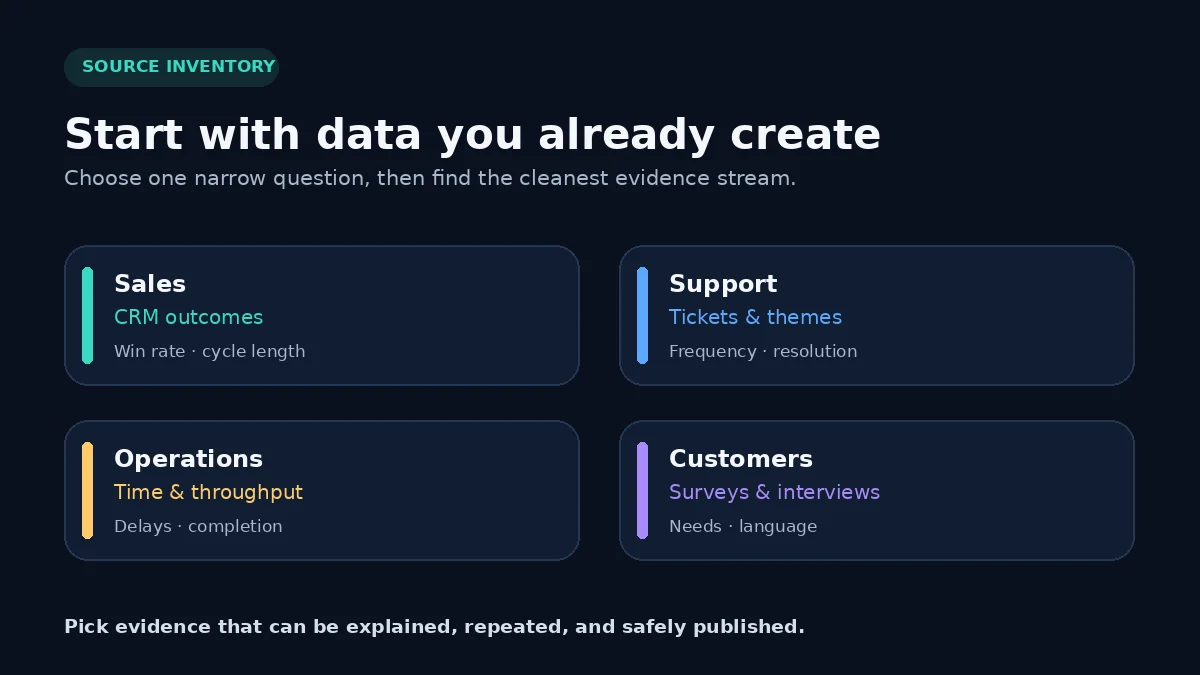
Useful starting points include:
- Sales: Which lead sources produce qualified conversations? How long does a typical deal take? Which objections appear before a lost opportunity?
- Support: Which questions recur most often? Which setup step causes the most follow-up? How does resolution time vary by issue type?
- Operations: Where do projects wait? Which service packages finish on schedule? Which handoff creates the most rework?
- Product usage: Which feature is used first? Where do trial users stop? Which workflow is common among retained accounts?
- Customer research: Which words do buyers use for the problem? Which selection criteria matter most? What changed after purchase?
Avoid questions that require sensitive personal data or imply conclusions your sample cannot support. “What did our 2026 onboarding tickets contain?” is answerable. “What every customer wants” is not.
If your team cannot define the decision the result will inform, keep the analysis internal until it can.
Use a source-selection gate
Not every internal dataset belongs in public. Score a candidate on five practical gates before investing in a polished page.
| Gate | Pass question | Common failure |
|---|---|---|
| Usefulness | Would the result help a customer or operator make a decision? | The number is interesting only inside the company. |
| Ownership | Did the business lawfully collect and control the source records? | The dataset was copied, licensed for another purpose, or scraped without a clear right to republish. |
| Privacy | Can the result be aggregated without exposing a person, account, or confidential detail? | Small groups, quotations, or combinations of fields make someone identifiable. |
| Quality | Are definitions, missing records, and duplicates understood? | A dashboard count is treated as truth without checking how it was produced. |
| Repeatability | Could another team member rerun the calculation from the stated rules? | The result depends on undocumented manual filtering. |
A failed gate does not always kill the idea. It may require a broader aggregation, a shorter claim, a documented cleanup, or a different question. When privacy or rights are uncertain, do not publish until the responsible owner has reviewed the dataset and intended use.
Build a method card before writing the headline
Write the method while the analysis is still fresh. If you cannot explain the number in plain language, you are not ready to promote it.
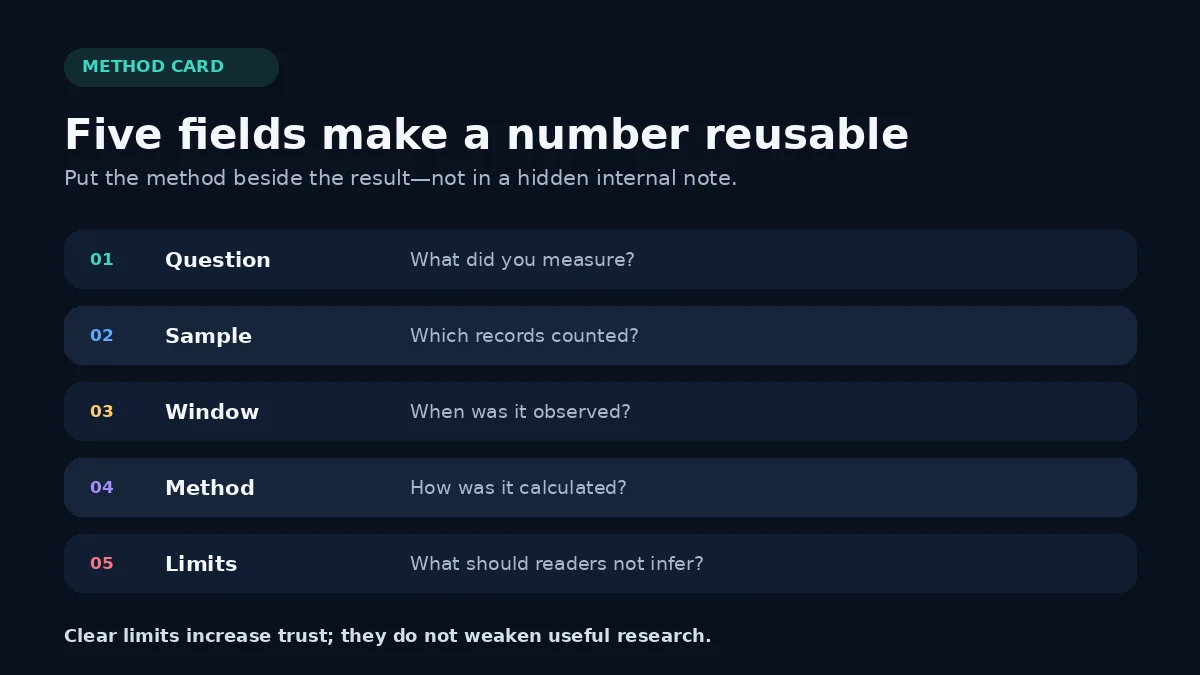
Every published result should answer:
- Question: What exactly did you test or count?
- Sample: Which records were included, excluded, or unavailable?
- Window: During which dates was the evidence observed?
- Method: How were fields cleaned, grouped, and calculated?
- Limits: What should a reader not conclude from the result?
Suppose a home-services company reviews 680 inbound inquiries received from January through June. It may report the median first-response time by channel. The method should say whether spam and duplicate inquiries were removed, what counted as a response, how after-hours messages were handled, and whether the analysis covers one city or several.
Those details prevent a local operational finding from being presented as a universal market benchmark. They also make the page easier to update because the next analyst knows which rules to repeat.
Publish the result in an answer-ready structure
A useful research page should not make readers excavate the main result. Put the answer near the top, then show the evidence and method in progressively deeper layers.
A practical structure is:
- One-sentence finding: the result, sample size, and observation window.
- Why it matters: the business decision the result can inform.
- Results table: the key groups, values, units, and sample counts.
- Method: inclusion rules, cleaning, calculations, and tools.
- Limitations: geography, sample bias, missing fields, and what was not measured.
- Implications: actions supported by the evidence, separated from speculation.
- Update note: publication date, latest refresh, and planned cadence.
Use semantic headings and real HTML tables rather than screenshots for the core numbers. Search systems, assistive technologies, and readers on small screens need the underlying text. Images should explain the workflow or pattern—not imprison the only copy of the result.
If the page describes a dataset, Schema.org's Dataset type provides properties such as description, creator, temporal coverage, and distribution. Use it only when the visible page genuinely represents a dataset, and follow Google's rule that structured data must match visible content. Markup is a description layer, not proof that a weak analysis is authoritative.
Protect privacy without making the method vague
Aggregation is necessary but not always sufficient. A cell containing two customers can expose information when paired with location, industry, date, or a recognizable quotation. Remove direct identifiers, review small segments, and avoid publishing combinations that could reasonably point back to one person or account.
Describe privacy decisions at the method level: for example, “results are shown only for categories with at least 20 records” or “open-text responses were coded into themes and are not quoted.” Do not publish a long list of transformations that accidentally reveals the sensitive source data you were trying to protect.
Consent and permitted use depend on what was collected, how it was collected, the promises made to customers, and the laws that apply. When the analysis uses anything beyond ordinary aggregated operations data, obtain the appropriate privacy or legal review rather than relying on a generic publishing checklist.
Keep one stable URL and show what changed
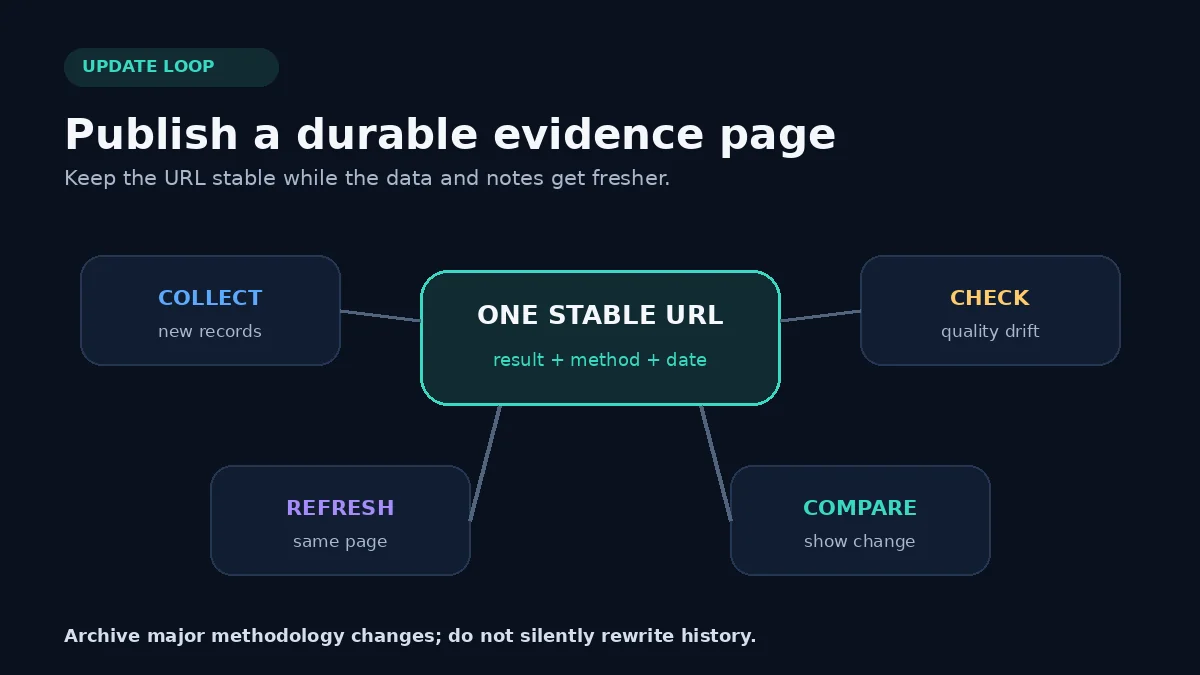
First-party research becomes more useful when it is maintained. A stable URL accumulates references and gives readers one canonical place to find the latest result. The page can show the newest observation window while preserving notes about major methodology changes.
Choose a cadence that matches the data:
- Monthly: high-volume support, usage, or lead datasets where meaningful movement can occur quickly.
- Quarterly: operational benchmarks with enough records to compare periods without reacting to weekly noise.
- Annually: surveys, seasonal businesses, or analyses where collection and review require more time.
Show the latest update date, current observation window, previous comparable value, and any method change. If a new CRM definition makes the result incomparable with last quarter, say so rather than drawing a clean trend line through incompatible data.
The content refresh workflow for AI visibility can help schedule checks for dates, links, examples, and structured data. Add the underlying calculation and privacy review to that routine for research pages.
Measure whether the asset is being used
Do not evaluate the page only by organic clicks. A first-party data asset may support sales calls, earn references from other sites, appear in AI answers, attract links, or improve a customer's confidence without becoming the highest-traffic page on the site.
Track distinct outcomes:
- citations and links from external pages;
- brand and page citations in answer engines;
- referral sessions from search, AI products, newsletters, and partner sites;
- assisted leads or sales conversations where the research was used;
- downloads, shares, or internal sales-team usage;
- corrections and questions that reveal where the method needs clarification.
Use the AI citation tracking workflow with a fixed set of questions related to the research. Preserve the cited URL and answer context. A single appearance is evidence of one appearance, not proof of a permanent ranking or a direct revenue effect.
Common mistakes that make original data less credible
- Leading with a dramatic percentage and hiding the sample. Put the denominator and window near the claim.
- Calling internal performance an industry benchmark. Label the scope accurately unless the sample was designed to represent the market.
- Removing inconvenient records without a rule. Define exclusions before promoting the result.
- Publishing a chart without accessible data. Include the key numbers in text or a semantic table.
- Changing the method silently. Add a methodology note and avoid false period-over-period comparisons.
- Treating correlation as cause. A pattern can guide the next test without proving why it occurred.
- Copying a competitor's survey. Ask a question your own customer relationships and operations place you in a position to answer.
- Inventing precision. Round values to a level justified by the sample and measurement process.
A one-week publishing sprint
A small team can turn one clean operational question into a durable asset without launching a large research program:
- Day 1: choose one decision and inventory the available records.
- Day 2: define the sample, window, exclusions, privacy threshold, and calculation.
- Day 3: clean the records and have a second person reproduce the key result.
- Day 4: draft the finding, results table, method, limitations, and implications.
- Day 5: review privacy, source rights, language, and numerical accuracy.
- Day 6: publish the stable page with visible dates, semantic structure, and accurate metadata.
- Day 7: add internal links, a citation-tracking question set, and the next refresh date.
Run the GEO visibility checklist after publishing to confirm crawlability, answer-ready copy, entity signals, and basic technical eligibility. Then connect the asset to the entity SEO workflow so the creator, brand, and official source are unambiguous.
Make evidence the product
The most defensible AI-search content is often not more commentary. It is evidence only your business is positioned to collect, packaged so another person can understand, question, and cite it.
Choose one narrow question. Use records you lawfully control. Publish the sample, window, method, and limits beside the result. Keep the URL stable, update it on a realistic cadence, and measure citations separately from leads and revenue. That process will not guarantee inclusion in any answer engine, but it will create a source worth evaluating—and a useful business asset even when no machine cites it. Pair the publish with the GEO visibility checklist and name the entity clearly using the business name generator workflow if positioning is still open.
Frequently asked questions
What counts as first-party data for a small business?
First-party data is information your business collects through direct operations and customer relationships, such as CRM outcomes, support themes, delivery times, product usage, surveys, and anonymized transaction patterns. Publish only what you can explain, aggregate safely, and support with a clear method.
Does original data guarantee an AI citation?
No. Original evidence can make a page more distinctive and useful, but no page is guaranteed inclusion in an AI answer. Crawl access, relevance, clarity, corroboration, freshness, and the answer engine's own source-selection process still matter.
How large should a research sample be?
There is no universal minimum. State the sample size, time window, inclusion rules, and limitations so readers can judge the result. A narrow, honestly labeled operational sample is more useful than an inflated claim based on unclear records.
How often should a first-party data page be updated?
Choose a schedule that matches how quickly the underlying evidence changes. Monthly can work for high-volume operations; quarterly or annually may be enough for smaller samples. Keep the URL stable and show the observation window and update date.